Soil Contribution

Components of SOM
1. Plant and Animal Residues: Fresh material like leaves, roots, and animal remains.
2. Active Fraction: Partially decomposed material that serves as food for soil microbes.
3. Stable Organic Matter (Humus): Fully decomposed material that remains in the soil
for decades or centuries, contributing to long-term soil health.

Benefits of SOM
1. Improved Soil Structure:
◦ Enhances soil aggregation.
◦ Increases porosity, improving water infiltration and aeration.
2. Water Retention:
◦ SOM can retain up to 20 times its weight in water, reducing drought stress.
3. Nutrient Supply:
◦ Serves as a reservoir of nutrients such as nitrogen, phosphorus, and sulfur.
◦ Gradually releases nutrients through mineralization.
4. Microbial Activity:
◦ Supports diverse microbial populations essential for nutrient cycling.
5. Carbon Storage:
◦ Acts as a carbon sink, mitigating climate change by storing atmospheric
carbon.

Managing SOM for Soil Health
1. Add Organic Materials:
◦ Compost, manure, or crop residues.
2. Reduce Erosion:
◦ Implement contour plowing, terracing, or cover crops.
3. Minimize Soil Disturbance:
◦ Practice no-till or reduced tillage farming.

Indicators of SOM Health
• Dark Color: Rich organic soils are often darker.
• High Microbial Activity: A sign of active decomposition and nutrient cycling.
• Soil Aggregates: Stable clumps of soil particles held together by organic matter.
• Soil Organic Carbon (SOC):
Refers specifically to the carbon component of soil organic matter. It is the measure of
the carbon stored in SOM, typically accounting for about 58% of the total SOM by
weight.
SOIL DEGRADATION
1. Indian vegetables, their nutritional value has dropped by 30% in last 25 yrs.in an
article ‘An Alarming Decline in the Nutritional Quality of Foods: The Biggest
Challenge for Future Generations’ Health’ published in 2024 by NIH (National
Institute of Health)
2. 62% of India’s soil has an organic content of less than 0.5%. published in an article by
By Dr. Priyom Bose, Ph.D. in Azo lifesciences and reported by CNBC in documentary’
The looming soil shortage’.
3. Soil needs at least 3-6% organic content to be alive. But in most parts of the world,
the situation is quite terrible.
4. It is a well-known fact that 95% of our food comes from the soil, but we have soil left
only for less than 60 years, reports FAO (Food and Agriculture Organization) in 2014
during a forum marking World Soil Day, 5th December 2020.
5. Worldwide, we have lost an astounding 52% of agricultural soils –90% of earth’s soil
could be lost in the next 30 years.
6. We have among the highest malnutrition children in the world. Almost 70% of Indian
children below 3 years are iron deficient and more than 80% Vit D deficient. Protein
level in Indian is very low. This was reported by National Institute of Health in 2014
7. Intensification of agriculture: Indian soil has deficiencies of zinc, boron and iron
according to Indian Institute of social science, Bhopal.
8. The level of protein in Indian foods both vegetarian and no vegetarian are declining
rapidly. For instance between 1993-94 and 2011-12 protein levels in
Beans dropped around 60%
Brown lentil dropped by 10%
goat meat dropped by 5%
report by NIN National institute of Nutrition (downearth.org)
9. Reports by NSSO (National sample survey office):
Rural households were consuming 56.5 g in 2011 down from 60.2g in 1993-94
urban households were consuming 55.7 g in 2011 down from 57.2g in 1993-94
10. Anurag Kurpad, head of physiology and nutrition department at St. John’s research
institute Bengaluru says that amount of protein consumed by most protein is not of
high quality.
11. As per NSSO cereals account for 58% for rural and 49% for urban populations total
protein intake which is not of high quality
Dal is one of the poorest source of protein unless you eat a certain ratio of daal to rice for
instance 1:4 in every meal
Quality of protein is determined by the number of amino acids
REASON FOR SOIL DEGRADATION
1. You may only have heard of earthworms, but there are zillions of lives that live in soil.
Just 1 teaspoon of soil has more organisms than our entire population.
2. It is this biodiversity that supplies so many nutrients to plants that grow our food. It is
this biodiversity that makes soil alive.
3. But, the unfortunate reality is that every year close to 27,000 of these species are
going extinct – entire species!
4. The main reason is excessive farming using fertilizers and pesticides and then burning
the fields.
5. Farmers are making the soil work more, growing two or more crops a year, instead of
one. This unplanned fertilization is increasing nutrient shortages and changing soils’
chemical composition .
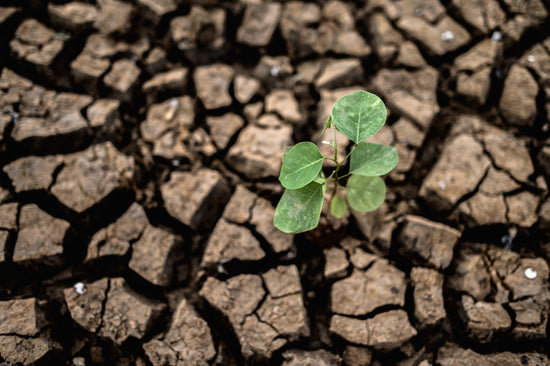
6. Levels of organic carbon in soil are dropping across the country, making soils more
vulnerable to erosion and possibly resulting in the number of earthworms falling.
7. Impact of Increased CO2 Levels: Elevated levels of atmospheric carbon dioxide have
been shown to reduce protein, iron, and zinc levels in crops. For example, grains and
cereals have experienced declines in their protein content under higher CO2
conditions. Legumes are somewhat less affected due to their nitrogen-fixing ability,
but they are not immune to nutrient reductions
8. DILUTION EFFECT:- High-yield crops often dilute nutrient concentrations due to the
"dilution effect" – when plants grow faster and larger but with less nutrient density per
unit.
9. Soil Degradation: Intensive farming practices have led to soil erosion and depletion of
essential minerals, directly impacting the nutrient content of crops. Over-reliance on
chemical fertilizers often neglects trace minerals, further exacerbating this issue.


| Category | Food Item | Protein Content (1950) | Protein Content (Recent Years) | Change (%) | Source |
|---|---|---|---|---|---|
| Grains | |||||
| Wheat (per 100g) | 14g | 12.5g | -10.7% | Davis et al. (2004); FAO reports | |
| Rice (per 100g) | 7.5g | 6.3g | -16% | Myers et al. (2014); The Counter | |
| Corn (Maize, per 100g) | 10.5g | 9.3g | -11.4% | Smith & Gregory (2013); FAO Data | |
| Quinoa (per 100g) | 14.1g | 13.2g | -6.4% | FAO; Nutrient Decline Studies | |
| Barley (per 100g) | 12g | 10.2g | -15% | Myers et al. (2014); FAO Reports | |
| Millet (per 100g) | 11g | 9.7g | -11.8% | FAO Data | |
| Sorghum (per 100g) | 11.3g | 10.1g | -10.6% | Research on Drought-Resistant Crops | |
| Legumes | |||||
| Soybean (per 100g) | 36g | 33.5g | -6.9% | Davis et al. (2004); Climate Impact Reports | |
| Lentils (per 100g) | 25g | 22.5g | -10% | Frontiers Research on Crop Nutrients | |
| Chickpeas (per 100g) | 20.5g | 19.3g | -5.9% | Global Crop Nutrient Reports | |
| Peanuts (per 100g) | 25.2g | 23.1g | -8.3% | Historical USDA Data | |
| Green Peas (per 100g) | 5.4g | 4.7g | -13% | Davis et al. (2004); FAO Reports | |
| Vegetables | |||||
| Spinach (per 100g) | 2.9g | 2.4g | -17.2% | USDA; Davis et al. (2004) | |
| Kale (per 100g) | 3.3g | 2.8g | -15.2% | Davis et al. (2004); FAO Reports | |
| Broccoli (per 100g) | 3.8g | 3.3g | -13.2% | Historical Nutrient Data | |
| Carrot (per 100g) | 0.9g | 0.7g | -22.2% | USDA; FAO | |
| Cabbage (per 100g) | 1.5g | 1.3g | -13.3% | Crop Nutrient Analysis | |
| Green Beans (per 100g) | 2.4g | 2.0g | -16.7% | Davis et al. (2004); FAO Reports | |
| Sweet Potato (per 100g) | 2.3g | 2.0g | -13% | USDA Database | |
| Tomato (per 100g) | 1.2g | 1.0g | -16.7% | USDA; Historical Records | |
| Fruits | |||||
| Apples (per 100g) | 0.4g | 0.3g | -25% | USDA; Fruit Crop Decline Reports | |
| Bananas (per 100g) | 1.3g | 1.1g | -15.4% | USDA; Global Crop Nutrient Studies | |
| Oranges (per 100g) | 0.9g | 0.7g | -22.2% | Nutrient Decline Studies | |
| Grapes (per 100g) | 0.8g | 0.6g | -25% | FAO; USDA Nutrient Data | |
| Watermelon (per 100g) | 0.7g | 0.6g | -14.3% | Historical USDA Data | |
| Avocado (per 100g) | 2.2g | 2.0g | -9.1% | USDA; Davis et al. (2004) | |
| Strawberries (per 100g) | 0.8g | 0.7g | -12.5% | FAO Data | |
| Mangoes (per 100g) | 0.9g | 0.8g | -11.1% | USDA; Nutrient Decline Reports | |
- Choosing a selection results in a full page refresh.


